Fort Pierce Utilities Authority (FPUA) provides economical, reliable, and friendly service to enhance the quality of life in its community. In addition to supplying electric power to 28,000 customers, FPUA also provides water, wastewater, natural gas, and internet services to customers on the eastern coast of Florida.
Challenge
Due to its coastal position, the utility faces periodic tropical storms and hurricanes. In recent years, severe weather has caused damage that challenged FPUA’s response and workflows. In addition, mutual aid crews from neighboring utilities provided much-needed additional labor. However, the use of additional crews further taxed the information flow and work management process.
Damage assessment teams relayed information by paper or radio. It wasn’t easy to ensure the complete and accurate transfer of crucial information transcribed to paper forms. Those forms piled up rapidly and became impossible to understand promptly. Jason Drost, the GIS manager at FPUA, observed, “When we were capturing outage information, pen and paper were king!”
Designers reviewed the damage reports to determine material requirements and generate assignments. Later, storm crews picked up printed work details at the start of their day. Once they were in the field, work became difficult to track as it was accomplished.
Without a current view of field activities, statistics and customer impact awareness were delayed until staff could manually process the information. This backlog of paper delayed restoration decision-making and entangled timely updates to the community.
Long after a storm, staff spent countless hours retrieving adequate Federal Emergency Management Agency (FEMA) documentation from multiple sources. They searched through activity logs, the outage management system, and files containing hundreds of photographs to re-create an accurate view of the restoration work.
Drost concluded, “Location was at the heart of everything—we needed to develop a data-driven geographic information system (GIS)-based hurricane response solution.”
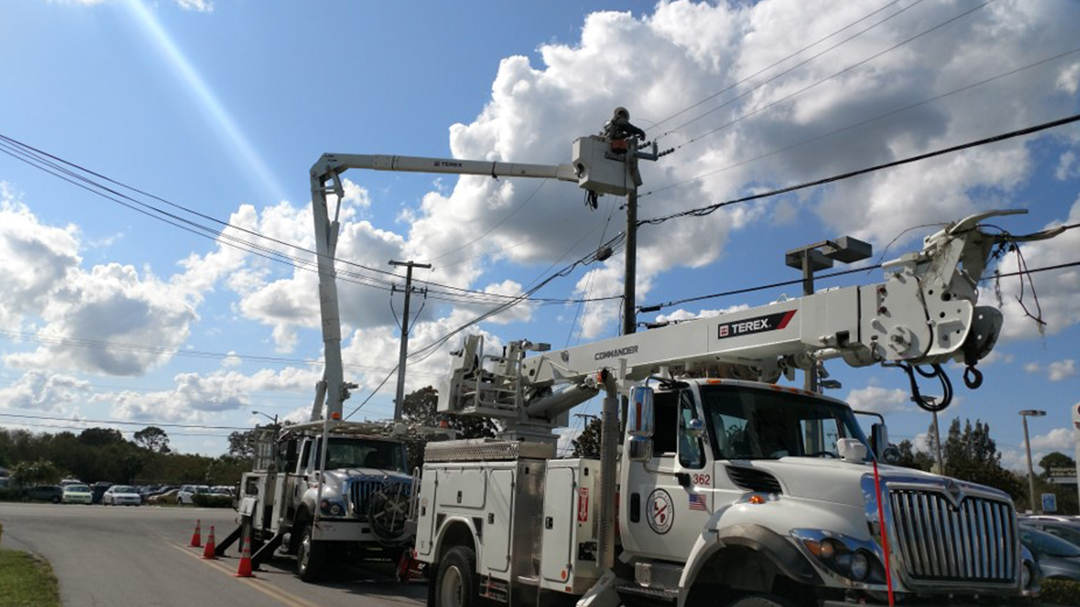
 Mutual Aid Crews working to restore power after Hurricane Irma
Solution
FPUA decided to manage storm information digitally by location. As a result, the utility can efficiently assess the damage, conduct restoration, and access data in a central location. Its goal was to capture damage data, assign work, restore power, maintain situational awareness, and create supporting documentation in the process.
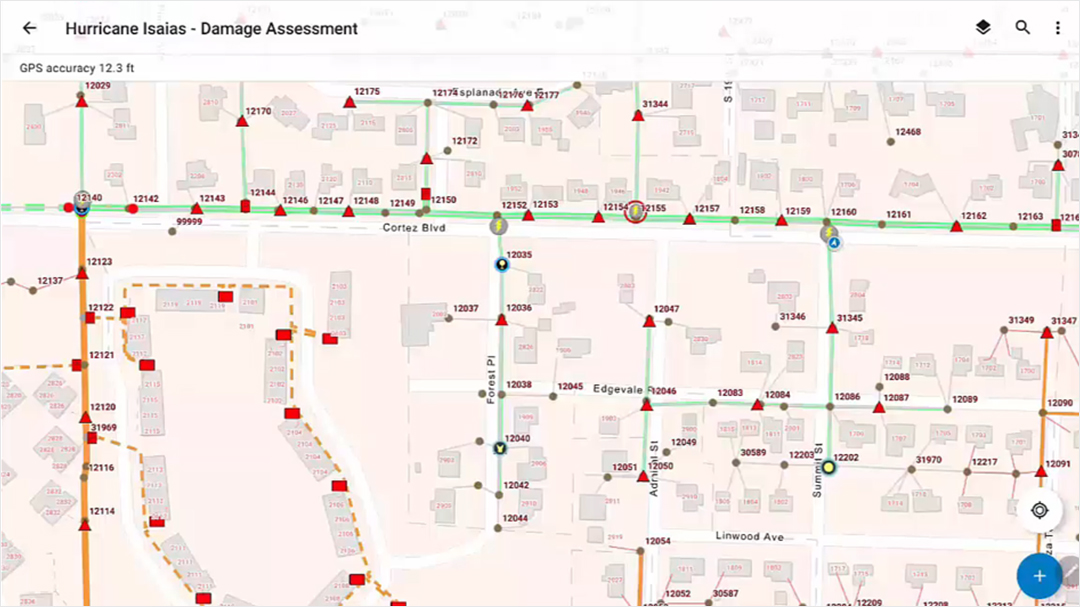
Patrol crews follow feeders while documenting damage using ArcGIS Field Maps. Smart forms streamline the data entry, allowing them also to capture supporting photographs and videos. Fuse status is captured to reflect customer outage counts and prioritize restoration accurately. Additionally, staff also note open fuses that do not show on their map. Subsequently, FPUA improves the system model accuracy by including these fuses that were not previously modeled in the outage management system (OMS).
Designers use an ArcGIS Web AppBuilder application to monitor damage information as it is received in real time. Designers review the reports and photos to create material lists, alert the warehouse, and queue jobs. Jobs without material requirements are assigned immediately using ArcGIS Workforce.
Field crews maximize effectiveness with clear work assignments on their device. Assignments are ready when they start their shift and updated continuously as restoration progresses. Workers have built-in access to real-time outage information provided by the OMS, which enhances safety. Moreover, crews can utilize convenient route optimization to navigate to the next work assignment efficiently.
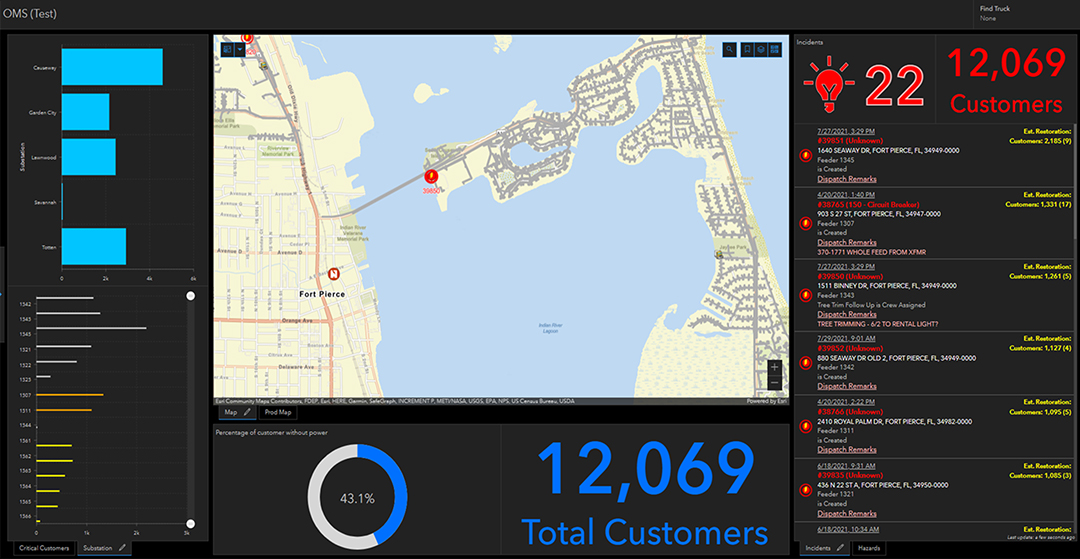
Crews denote when they start and complete each assignment, capturing important FEMA documentation time stamps and providing real-time feedback on work status. Dashboards created using ArcGIS Dashboards display the current situation and serve as essential decision-making tools. They indicate the location of outages, the count of customers without power, incidents on each substation, and other relevant information. Furthermore, they are easily filtered for vital information such as affected critical customers.
 ArcGIS Field Maps used for verification of de-energized devices and streamlining damage collection after a storm.
Results
Live drills with FPUA staff verified the efficiency of the improved tools and process. The emphasis was to make the crews comfortable with the software, focusing on their restoration work.
Consequently, when the next storm hits, the utility can assess damage quickly and optimize restoration.
Improved material estimating and communication will reduce unnecessary trips to the warehouse. Work can be distributed rapidly to trained staff overseeing out-of-town crews. By improving records and the OMS model, customer counts will be more accurate. And real-time awareness will drive decision-making to conduct operations in the most logical order to reduce outage impacts.
Drost stated, “This process should significantly improve our restoration time by reducing delays that we experienced in the past and also streamlining the gathering of materials. In addition, now we know better how to prioritize work and which restored section is going to give us the most bang for the buck.”
Finally, the built-in documentation of work, time stamps, and materials will drastically cut the time spent on FEMA reporting. What used to take three staff members hours to accomplish can be done quickly by a single clerk.
Beyond storm response, FPUA leverages similar apps and dashboards in many everyday workflows. These include tree trimming, streetlight repair and LED upgrade, underground facility and pole inspections, and gas leak inspections.
Fort Pierce Utility Authority uses modern tools and location technology to improve the quality of life in its community, even in the face of severe weather events.
 Outage Restoration Situational Dashboard used as decision making tool


